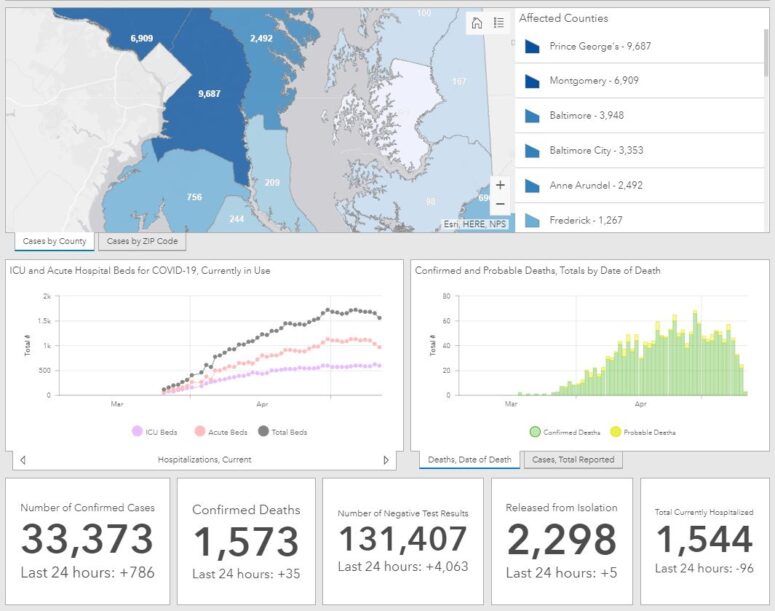
As of Monday, May 11, 2020, Maryland reports 33,373 cases of COVID-19 and 1,573 deaths. An increase of 786 cases and 35 deaths. The number of negative test results is currently 131,407 an increase of 4,063.
COVID-19 Statistics in Maryland
Number of confirmed cases : 33,373
Number of negative test results : 131,407
Number of confirmed deaths : 1,573
Number of probable deaths : 110
Currently hospitalized : 1,544
Acute care : 959
Intensive care : 585
Ever hospitalized : 6,183
Released from isolation : 2,298
Cases and Deaths Data Breakdown:
Parenthesis = Confirmed death, laboratory-confirmed positive COVID-19 test result
Asterisk = Probable death, death certificate lists COVID-19 as the cause of death but not yet confirmed by a laboratory test
NH = Non-Hispanic
By County
| County | Cases | Deaths | |
| Allegany | 146 | (12) | |
| Anne Arundel | 2,492 | (115) | 9* |
| Baltimore City | 3,353 | (162) | 9* |
| Baltimore County | 3,948 | (178) | 16* |
| Calvert | 209 | (10) | 1* |
| Caroline | 167 | ||
| Carroll | 583 | (58) | |
| Cecil | 267 | (13) | |
| Charles | 756 | (53) | 1* |
| Dorchester | 98 | (2) | |
| Frederick | 1,267 | (68) | 6* |
| Garrett | 6 | ||
| Harford | 605 | (21) | 4* |
| Howard | 1,223 | (30) | 1* |
| Kent | 116 | (13) | |
| Montgomery | 6,909 | (353) | 35* |
| Prince George’s | 9,687 | (342) | 17* |
| Queen Anne’s | 100 | (9) | |
| St. Mary’s | 244 | (9) | |
| Somerset | 50 | ||
| Talbot | 61 | (1) | |
| Washington | 283 | (9) | |
| Wicomico | 690 | (16) | |
| Worcester | 113 | (3) | 1* |
| Data not available | (96) | 10* |
By Age Range and Gender
| Age/Gender | Cases | Deaths | |
| 0-9 | 570 | ||
| 10-19 | 1,131 | ||
| 20-29 | 4,299 | (10) | 1* |
| 30-39 | 5,952 | (19) | 2* |
| 40-49 | 5,989 | (39) | 4* |
| 50-59 | 5,707 | (106) | 8* |
| 60-69 | 4,255 | (239) | 11* |
| 70-79 | 2,840 | (384) | 15* |
| 80+ | 2,630 | (676) | 59* |
| Data not available | (100) | 10* | |
| Female | 17,505 | (767) | 60* |
| Male | 15,868 | (806) | 50* |
By Race and Ethnicity
| Race/Ethnicity | Cases | Deaths | |
| African-American (NH) | 10,927 | (638) | 38* |
| Asian (NH) | 691 | (52) | 5* |
| White (NH) | 7,260 | (645) | 51* |
| Hispanic | 7,057 | (114) | 6* |
| Other (NH) | 1,387 | (22) | |
| Data not available | 6,051 | (102) | 10* |

