As of Thursday, July 16, 2020, Maryland reports 75,664 COVID-19 cases and 3,215 deaths. An increase of 648 cases and 6 deaths overnight.
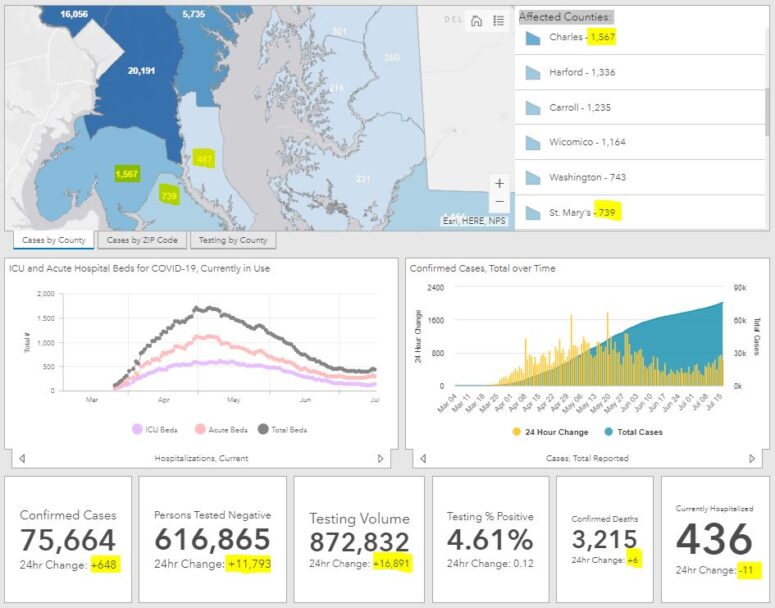
COVID-19 Statistics in Maryland
Number of confirmed cases : 75,664
Number of persons tested negative : 616,865
Total testing volume : 872,832
Number of confirmed deaths : 3,215
Number of probable deaths : 132
Currently hospitalized : 436
Acute care : 299
Intensive care : 137
Ever hospitalized : 11,687
Released from isolation : 5,286
Cases and Deaths Data Breakdown:
Parenthesis = Confirmed death, laboratory-confirmed positive COVID-19 test result
Asterisk = Probable death, death certificate lists COVID-19 as the cause of death but not yet confirmed by a laboratory test
NH = Non-Hispanic
By County
| County | Cases | Deaths | |
| Allegany | 224 | (18) | |
| Anne Arundel | 5,735 | (203) | 8* |
| Baltimore City | 8,998 | (359) | 14* |
| Baltimore County | 9,261 | (482) | 22* |
| Calvert | 467 | (26) | 1* |
| Caroline | 350 | (3) | |
| Carroll | 1,235 | (113) | 3* |
| Cecil | 538 | (28) | 1* |
| Charles | 1,567 | (88) | 2* |
| Dorchester | 231 | (5) | |
| Frederick | 2,655 | (113) | 7* |
| Garrett | 29 | ||
| Harford | 1,336 | (63) | 3* |
| Howard | 2,957 | (91) | 6* |
| Kent | 211 | (22) | 1* |
| Montgomery | 16,056 | (725) | 38* |
| Prince George’s | 20,191 | (696) | 23* |
| Queen Anne’s | 301 | (22) | 1* |
| St. Mary’s | 739 | (51) | |
| Somerset | 105 | (3) | |
| Talbot | 216 | (4) | |
| Washington | 743 | (29) | |
| Wicomico | 1,164 | (42) | |
| Worcester | 355 | (17) | 1* |
| Data not available | (12) | 1* |
By Age Range and Gender
| Age/Gender | Cases | Deaths | |
| 0-9 | 2,387 | ||
| 10-19 | 4,207 | (1) | |
| 20-29 | 11,972 | (18) | 1* |
| 30-39 | 14,183 | (42) | 5* |
| 40-49 | 13,142 | (102) | 3* |
| 50-59 | 11,639 | (254) | 13* |
| 60-69 | 8,243 | (523) | 12* |
| 70-79 | 5,173 | (793) | 20* |
| 80+ | 4,718 | (1,472) | 77* |
| Data not available | (10) | 1* | |
| Female | 39,437 | (1,581) | 69* |
| Male | 36,227 | (1,634) | 63* |
By Race and Ethnicity
| Race/Ethnicity | Cases | Deaths | |
| African-American (NH) | 22,000 | (1,308) | 49* |
| Asian (NH) | 1,475 | (124) | 6* |
| White (NH) | 15,599 | (1,365) | 68* |
| Hispanic | 19,937 | (370) | 8* |
| Other (NH) | 3,608 | (36) | |
| Data not available | 13,045 | (12) | 1* |