 As of Monday, July 27, 2020, Maryland reports 84,876 COVID-19 cases and 3,315 deaths. An increase of 3,110 cases and 22 deaths, since Friday, July 24, 2020.
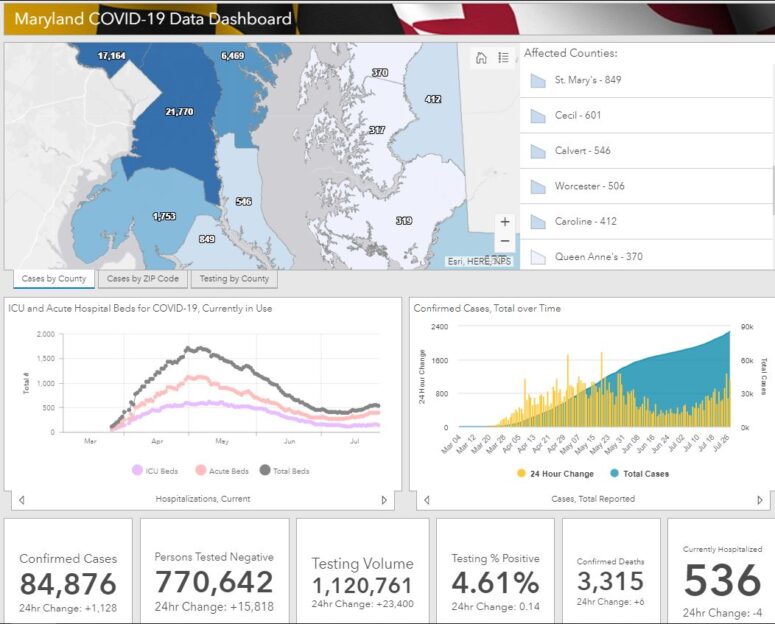
COVID-19 Statistics in Maryland
Number of confirmed cases : 84,876
Number of persons tested negative : 770,642
Total testing volume : 1,120,761
Number of confirmed deaths : 3,315
Number of probable deaths : 132
Currently hospitalized : 536
Acute care : 391
Intensive care : 145
Ever hospitalized : 12,339
Released from isolation : 5,434
Cases and Deaths Data Breakdown:
Parenthesis = Confirmed death, laboratory-confirmed positive COVID-19 test result
Asterisk = Probable death, death certificate lists COVID-19 as the cause of death but not yet confirmed by a laboratory test
NH = Non-Hispanic
By County
| County | Cases | Deaths | |
| Allegany | 260 | (18) | |
| Anne Arundel | 6,469 | (206) | 8* |
| Baltimore City | 10,579 | (387) | 14* |
| Baltimore County | 11,124 | (508) | 20* |
| Calvert | 546 | (26) | 1* |
| Caroline | 412 | (3) | |
| Carroll | 1,391 | (113) | 2* |
| Cecil | 601 | (29) | 1* |
| Charles | 1,753 | (88) | 2* |
| Dorchester | 319 | (5) | |
| Frederick | 2,909 | (113) | 7* |
| Garrett | 43 | ||
| Harford | 1,631 | (64) | 3* |
| Howard | 3,373 | (96) | 6* |
| Kent | 229 | (22) | 1* |
| Montgomery | 17,164 | (748) | 39* |
| Prince George’s | 21,770 | (707) | 23* |
| Queen Anne’s | 370 | (22) | 1* |
| St. Mary’s | 849 | (52) | |
| Somerset | 115 | (3) | |
| Talbot | 317 | (4) | |
| Washington | 897 | (30) | |
| Wicomico | 1,249 | (42) | |
| Worcester | 506 | (17) | 1* |
| Data not available | (12) | 3* |
By Age Range and Gender
| Age/Gender | Cases | Deaths | |
| 0-9 | 2,777 | ||
| 10-19 | 5,034 | (1) | |
| 20-29 | 14,378 | (18) | 1* |
| 30-39 | 16,006 | (44) | 5* |
| 40-49 | 14,449 | (105) | 3* |
| 50-59 | 12,795 | (264) | 14* |
| 60-69 | 8,926 | (544) | 11* |
| 70-79 | 5,523 | (820) | 20* |
| 80+ | 4,988 | (1,509) | 75* |
| Data not available | (10) | 3* | |
| Female | 44,487 | (1,630) | 69* |
| Male | 40,389 | (1,685) | 63* |
By Race and Ethnicity
| Race/Ethnicity | Cases | Deaths | |
| African-American (NH) | 25,440 | (1,357) | 48* |
| Asian (NH) | 1,606 | (125) | 6* |
| White (NH) | 18,284 | (1,400) | 66* |
| Hispanic | 21,115 | (386) | 9* |
| Other (NH) | 3,917 | (35) | |
| Data not available | 14,514 | (12) | 3* |