As of Tuesday, July 28, 2020, Maryland reports 85,524 COVID-19 cases and 3,327 deaths. An increase of 678 cases and 12 deaths, in 24 hours.
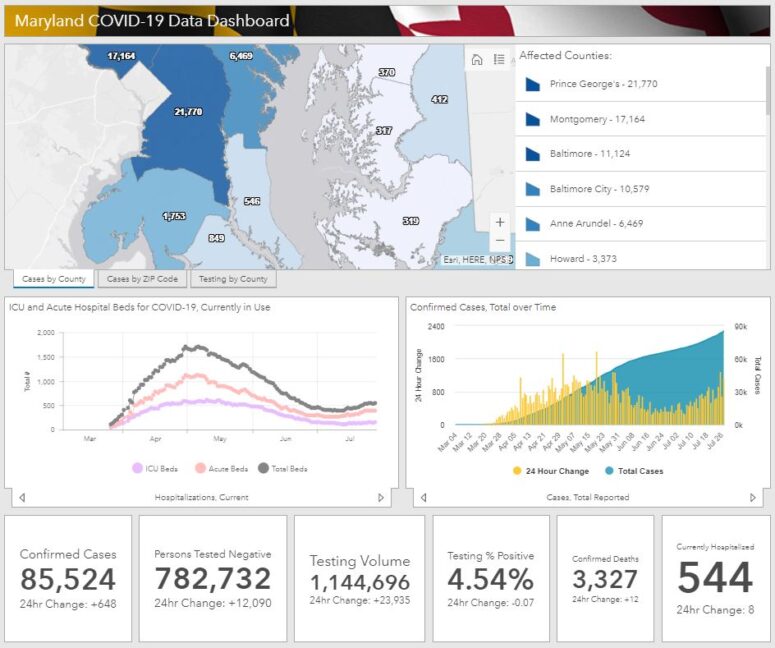
COVID-19 Statistics in Maryland
Number of confirmed cases : 85,524
Number of persons tested negative : 782,732
Total testing volume : 1,144,696
Number of confirmed deaths : 3,327
Number of probable deaths : 131
Currently hospitalized : 544
Acute care : 394
Intensive care : 150
Ever hospitalized : 12,389
Released from isolation : 5,592
Cases and Deaths Data Breakdown:
Parenthesis = Confirmed death, laboratory-confirmed positive COVID-19 test result
Asterisk = Probable death, death certificate lists COVID-19 as the cause of death but not yet confirmed by a laboratory test
NH = Non-Hispanic
By County
| County | Cases | Deaths | |
| Allegany | 262 | (18) | |
| Anne Arundel | 6,537 | (206) | 8* |
| Baltimore City | 10,702 | (389) | 14* |
| Baltimore County | 11,252 | (512) | 22* |
| Calvert | 552 | (26) | 1* |
| Caroline | 416 | (3) | |
| Carroll | 1,402 | (114) | 2* |
| Cecil | 607 | (29) | 1* |
| Charles | 1,772 | (88) | 2* |
| Dorchester | 319 | (5) | |
| Frederick | 2,931 | (113) | 7* |
| Garrett | 48 | ||
| Harford | 1,648 | (64) | 3* |
| Howard | 3,410 | (96) | 6* |
| Kent | 224 | (22) | 1* |
| Montgomery | 17,230 | (748) | 39* |
| Prince George’s | 21,870 | (708) | 23* |
| Queen Anne’s | 375 | (22) | 1* |
| St. Mary’s | 855 | (53) | |
| Somerset | 116 | (3) | |
| Talbot | 320 | (4) | |
| Washington | 914 | (30) | |
| Wicomico | 1,256 | (42) | |
| Worcester | 506 | (17) | 1* |
| Data not available | (15) |
By Age Range and Gender
| Age/Gender | Cases | Deaths | |
| 0-9 | 2,812 | ||
| 10-19 | 5,112 | (1) | |
| 20-29 | 14,517 | (19) | 1* |
| 30-39 | 16,122 | (44) | 5* |
| 40-49 | 14,537 | (106) | 3* |
| 50-59 | 12,879 | (263) | 15* |
| 60-69 | 8,988 | (545) | 11* |
| 70-79 | 5,552 | (823) | 21* |
| 80+ | 5,005 | (1,514) | 75* |
| Data not available | (12) | ||
| Female | 44,838 | (1,638) | 68* |
| Male | 40,686 | (1,689) | 63* |
By Race and Ethnicity
| Race/Ethnicity | Cases | Deaths | |
| African-American (NH) | 25,880 | (1,361) | 49* |
| Asian (NH) | 1,618 | (125) | 6* |
| White (NH) | 18,540 | (1,405) | 67* |
| Hispanic | 21,228 | (386) | 9* |
| Other (NH) | 3,953 | (35) | |
| Data not available | 14,305 | (15) |