As of Wednesdey, August 5, 2020, Maryland reports 92,426 COVID-19 cases and 3,402 deaths. An increase of 1,282 cases and 13 deaths, in last 48 hours.
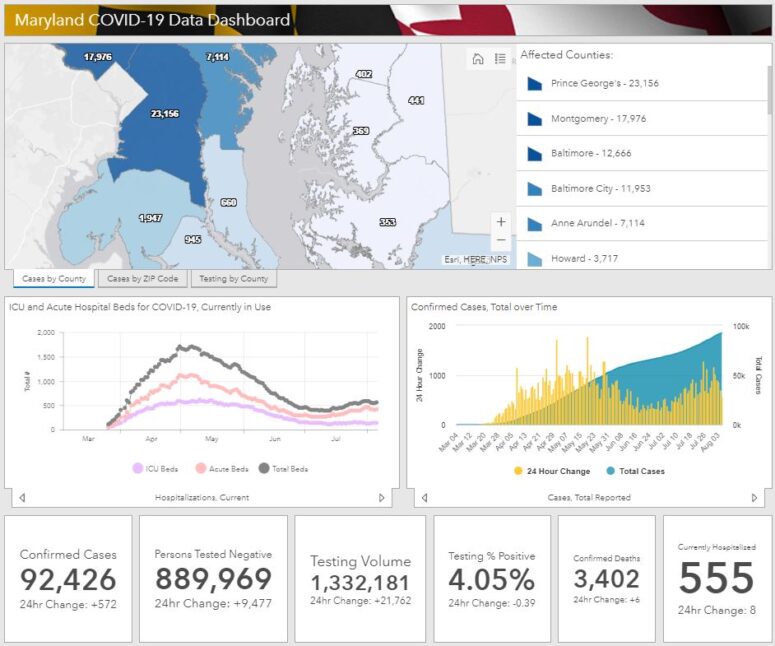
COVID-19 Statistics in Maryland
Number of confirmed cases : 92,426
Number of persons tested negative : 889,969
Total testing volume : 1,332,181
Number of confirmed deaths : 3,402
Number of probable deaths : 134
Currently hospitalized : 555
Acute care : 421
Intensive care : 134
Ever hospitalized : 12,922
Released from isolation : 5,749
Cases and Deaths Data Breakdown:
Parenthesis = Confirmed death, laboratory-confirmed positive COVID-19 test result
Asterisk = Probable death, death certificate lists COVID-19 as the cause of death but not yet confirmed by a laboratory test
NH = Non-Hispanic
By County
| County | Cases | Deaths | |
| Allegany | 276 | (18) | |
| Anne Arundel | 7,114 | (211) | 9* |
| Baltimore City | 11,953 | (406) | 15* |
| Baltimore County | 12,666 | (533) | 22* |
| Calvert | 660 | (27) | 1* |
| Caroline | 441 | (3) | |
| Carroll | 1,511 | (115) | 2* |
| Cecil | 672 | (29) | 1* |
| Charles | 1,947 | (89) | 2* |
| Dorchester | 353 | (5) | |
| Frederick | 3,020 | (114) | 7* |
| Garrett | 45 | ||
| Harford | 1,878 | (66) | 3* |
| Howard | 3,717 | (100) | 6* |
| Kent | 235 | (22) | 1* |
| Montgomery | 17,976 | (755) | 39* |
| Prince George’s | 23,156 | (723) | 23* |
| Queen Anne’s | 402 | (24) | 1* |
| St. Mary’s | 945 | (52) | |
| Somerset | 129 | (3) | |
| Talbot | 369 | (4) | |
| Washington | 989 | (31) | |
| Wicomico | 1,316 | (44) | |
| Worcester | 656 | (19) | 1* |
| Data not available | (9) | 1* |
By Age Range and Gender
| Age/Gender | Cases | Deaths | |
| 0-9 | 3,128 | ||
| 10-19 | 5,852 | (1) | |
| 20-29 | 16,114 | (20) | 1* |
| 30-39 | 17,395 | (45) | 5* |
| 40-49 | 15,526 | (108) | 3* |
| 50-59 | 13,821 | (271) | 15* |
| 60-69 | 9,521 | (559) | 12* |
| 70-79 | 5,908 | (840) | 22* |
| 80+ | 5,161 | (1,551) | 75* |
| Data not available | (7) | 1* | |
| Female | 48,619 | (1,670) | 70* |
| Male | 43,807 | (1,732) | 64* |
By Race and Ethnicity
| Race/Ethnicity | Cases | Deaths | |
| African-American (NH) | 28,480 | (1,397) | 50* |
| Asian (NH) | 1,674 | (127) | 6* |
| White (NH) | 20,106 | (1,439) | 67* |
| Hispanic | 23,217 | (394) | 10* |
| Other (NH) | 4,070 | (36) | |
| Data not available | 14,879 | (9) | 1* |