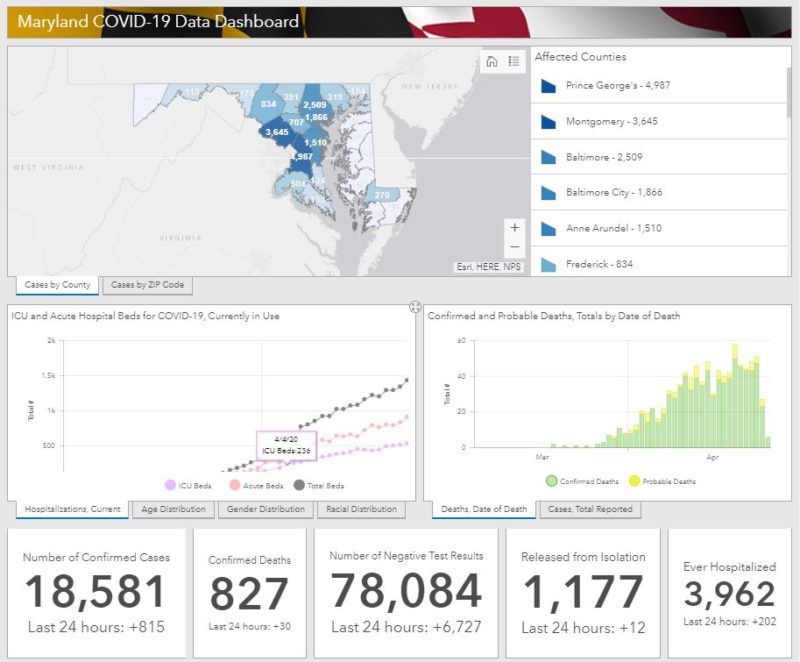
 As of Sunday, April 26, 2020, at 10:30 a.m., Maryland reports 18,581 confirmed CODID-19 cases and 827 deaths, an increase of 815 cases and 30 deaths overnight.
An additional 6,727 negative cases, 12 patients released from isolation, and 202 patients were hospitalized overnight, with a total of 1,463 total patients hospitalized.
Number of confirmed cases: 18,581
Number of negative test results: 78,084
Number of confirmed deaths: 827
Number of probable deaths: 83
Currently hospitalized: 1463
Acute care: 933
Intensive care: 530
Ever hospitalized: 3,962
Released from isolation: 1,177
Cases and Deaths Data Breakdown:
Parenthesis = Confirmed death, laboratory-confirmed positive COVID-19 test result
Asterisk = Probable death, death certificate lists COVID-19 as the cause of death but not yet confirmed by a laboratory test
NH = Non-Hispanic
By County
| County | Cases | Deaths | ||
| Allegany | 113 | (3) | ||
| Anne Arundel | 1,510 | (63) | 8* | |
| Baltimore City | 1,866 | (73) | 6* | |
| Baltimore County | 2,509 | (71) | 10* | |
| Calvert | 134 | (7) | ||
| Caroline | 63 | |||
| Carroll | 391 | (36) | ||
| Cecil | 154 | (5) | ||
| Charles | 504 | (34) | 1* | |
| Dorchester | 46 | (2) | ||
| Frederick | 834 | (39) | 6* | |
| Garrett | 4 | |||
| Harford | 319 | (4) | 7* | |
| Howard | 707 | (15) | 1* | |
| Kent | 68 | (3) | ||
| Montgomery | 3,645 | (160) | 20* | |
| Prince George’s | 4,987 | (163) | 11* | |
| Queen Anne’s | 53 | (3) | ||
| St. Mary’s | 133 | (6) | ||
| Somerset | 16 | |||
| Talbot | 34 | (1) | ||
| Washington | 173 | (3) | ||
| Wicomico | 270 | (4) | ||
| Worcester | 48 | |||
| Data Not Available | (132) | 13* |
By Age Range and Gender
| Age/Gender | Cases | Deaths | |
| 0-9 | 212 | ||
| 10-19 | 463 | ||
| 20-29 | 2,097 | (4) | |
| 30-39 | 3,109 | (12) | 1* |
| 40-49 | 3,270 | (18) | 2* |
| 50-59 | 3,414 | (54) | 5* |
| 60-69 | 2,651 | (117) | 9* |
| 70-79 | 1,837 | (185) | 12* |
| 80+ | 1,528 | (305) | 41* |
| Age Data Not Available | (132) | 13* | |
| Female: | 9,963 | (400) | 48* |
| Male: | 8,618 | (427) | 35* |
| Gender Data Not Available: |
By Race and Ethnicity
| Race/Ethnicity | Cases | Deaths | |
| African-American (NH) | 6,742 | (305) | 24* |
| Asian (NH) | 363 | (30) | 2* |
| White (NH) | 4276 | (301) | 44* |
| Hispanic | 2,841 | (46) | |
| Other (NH) | 707 | (11) | |
| Data Not Available | 3,652 | (134) | 13* |

