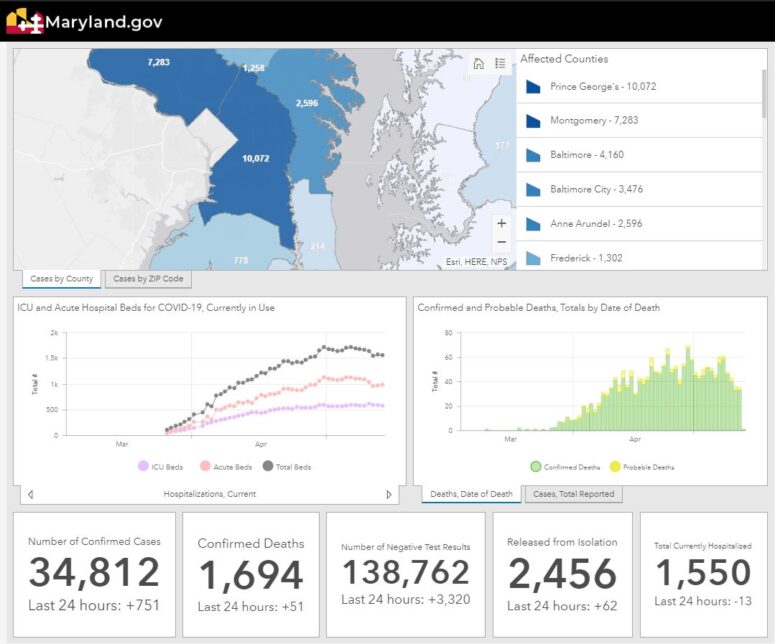
As of Wednesday, May 13, 2020, Maryland reports 34,812 cases of COVID-19 and 1,694 deaths. An increase of 751 cases and 51 deaths. The number of negative test results is currently 138,762 an increase of 3.320.
COVID-19 Statistics in Maryland
Number of confirmed cases : 34,812
Number of negative test results : 138,762
Number of confirmed deaths : 1,694
Number of probable deaths : 115
Currently hospitalized : 1,550
Acute care : 978
Intensive care : 572
Ever hospitalized : 6,404
Released from isolation : 2,456
Cases and Deaths Data Breakdown:
Parenthesis = Confirmed death, laboratory-confirmed positive COVID-19 test result
Asterisk = Probable death, death certificate lists COVID-19 as the cause of death but not yet confirmed by a laboratory test
NH = Non-Hispanic
By County
| County | Cases | Deaths | |
| Allegany | 149 | (13) | |
| Anne Arundel | 2,596 | (123) | 10* |
| Baltimore City | 3,476 | (177) | 9* |
| Baltimore County | 4,160 | (203) | 15* |
| Calvert | 214 | (12) | 1* |
| Caroline | 177 | ||
| Carroll | 595 | (61) | |
| Cecil | 271 | (15) | |
| Charles | 778 | (56) | 1* |
| Dorchester | 102 | (2) | |
| Frederick | 1,302 | (74) | 6* |
| Garrett | 6 | ||
| Harford | 629 | (24) | 4* |
| Howard | 1,258 | (36) | 2* |
| Kent | 123 | (13) | |
| Montgomery | 7,283 | (386) | 36* |
| Prince George’s | 10,072 | (370) | 19* |
| Queen Anne’s | 104 | (9) | |
| St. Mary’s | 254 | (9) | |
| Somerset | 51 | ||
| Talbot | 62 | (1) | |
| Washington | 287 | (9) | |
| Wicomico | 738 | (17) | |
| Worcester | 125 | (3) | 1* |
| Data not available | (81) | 11* |
By Age Range and Gender
| Age/Gender | Cases | Deaths | |
| 0-9 | 635 | ||
| 10-19 | 1,238 | ||
| 20-29 | 4,517 | (10) | 1* |
| 30-39 | 6,236 | (20) | 3* |
| 40-49 | 6,282 | (45) | 4* |
| 50-59 | 5,898 | (114) | 9* |
| 60-69 | 4,394 | (263) | 11* |
| 70-79 | 2,912 | (417) | 16* |
| 80+ | 2,700 | (744) | 60* |
| Data not available | (81) | 11* | |
| Female | 18,212 | (838) | 64* |
| Male | 16,600 | (856) | 51* |
By Race and Ethnicity
| Race/Ethnicity | Cases | Deaths | |
| African-American (NH) | 11,140 | (691) | 39* |
| Asian (NH) | 689 | (58) | 5* |
| White (NH) | 7,367 | (704) | 54* |
| Hispanic | 7,483 | (133) | 6* |
| Other (NH) | 1,703 | (23) | |
| Data not available | 6,430 | (85) | 11* |

