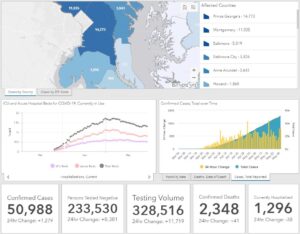
 As of Friday, May 29, 2020, Maryland reports 50,988 COVID-19 cases and 2,348 deaths. An increase of 1,279 cases and 41 deaths. Number of negative test results is currently 233,530, an increase of 11,517.
COVID-19 Statistics in Maryland
Number of confirmed cases : 50,988
Number of persons tested negative : 233,530
Total testing volume : 328,516
Number of confirmed deaths : 2,348
Number of probable deaths : 118
Currently hospitalized : 1,296
Acute care : 789
Intensive care : 507
Ever hospitalized : 8,479
Released from isolation : 3,571
Cases and Deaths Data Breakdown:
Parenthesis = Confirmed death, laboratory-confirmed positive COVID-19 test result
Asterisk = Probable death, death certificate lists COVID-19 as the cause of death but not yet confirmed by a laboratory test
NH = Non-Hispanic
By County
| County | Cases | Deaths | |
| Allegany | 177 | (16) | |
| Anne Arundel | 3,643 | (158) | 9* |
| Baltimore City | 5,426 | (240) | 8* |
| Baltimore County | 5,819 | (320) | 16* |
| Calvert | 329 | (16) | 1* |
| Caroline | 248 | ||
| Carroll | 861 | (83) | 2* |
| Cecil | 364 | (22) | |
| Charles | 1,056 | (71) | 1* |
| Dorchester | 140 | (3) | |
| Frederick | 1,856 | (98) | 7* |
| Garrett | 10 | ||
| Harford | 854 | (46) | 3* |
| Howard | 1,868 | (54) | 4* |
| Kent | 167 | (17) | |
| Montgomery | 11,035 | (555) | 40* |
| Prince George’s | 14,773 | (506) | 24* |
| Queen Anne’s | 160 | (12) | |
| St. Mary’s | 460 | (20) | |
| Somerset | 73 | (2) | |
| Talbot | 91 | (1) | |
| Washington | 441 | (13) | |
| Wicomico | 931 | (30) | |
| Worcester | 206 | (12) | 1* |
| Data not available | (53) | 2* |
By Age Range and Gender
| Age/Gender | Cases | Deaths | |
| 0-9 | 1,224 | ||
| 10-19 | 2,191 | (1) | |
| 20-29 | 7,033 | (12) | 1* |
| 30-39 | 9,460 | (29) | 4* |
| 40-49 | 9,212 | (68) | 3* |
| 50-59 | 8,354 | (160) | 10* |
| 60-69 | 5,996 | (374) | 12* |
| 70-79 | 3,877 | (581) | 17* |
| 80+ | 3,641 | (1,070) | 69* |
| Data not available | (53) | 2* | |
| Female | 26,527 | (1,156) | 65* |
| Male | 24,461 | (1,192) | 53* |
By Race and Ethnicity
| Race/Ethnicity | Cases | Deaths | |
| African-American (NH) | 14,613 | (972) | 40* |
| Asian (NH) | 948 | (89) | 6* |
| White (NH) | 9,869 | (982) | 61* |
| Hispanic | 12,610 | (215) | 7* |
| Other (NH) | 2,478 | (30) | |
| Data not available | 10,470 | (60) | 4* |

