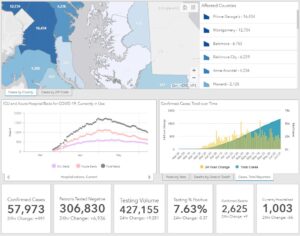
 On Sunday, June 7, 2020, Maryland reports 57,973 confirmed cases of COVID-19 and 2,625 deaths. An increase of 491 cases, and 9 deaths. Negative tests results now total 306,830, an increase of 6,936 tests.
Testing positivity continues to drop and is now under 8% at 7.63%, compared to 8.44% on Friday, June 5, 2020.
COVID-19 Statistics in Maryland
Number of confirmed cases : 57,973
Number of persons tested negative : 306,830
Total testing volume : 427,155
Number of confirmed deaths : 2,625
Number of probable deaths : 124
Currently hospitalized : 1,003
Acute care : 599
Intensive care : 404
Ever hospitalized : 9,546
Released from isolation : 4,240
Cases and Deaths Data Breakdown:
Parenthesis = Confirmed death, laboratory-confirmed positive COVID-19 test result
Asterisk = Probable death, death certificate lists COVID-19 as the cause of death but not yet confirmed by a laboratory test
NH = Non-Hispanic
By County
| County | Cases | Deaths | |
| Allegany | 184 | (16) | |
| Anne Arundel | 4,236 | (176) | 9* |
| Baltimore City | 6,229 | (273) | 8* |
| Baltimore County | 6,753 | (369) | 17* |
| Calvert | 358 | (20) | 1* |
| Caroline | 272 | (1) | |
| Carroll | 952 | (98) | 3* |
| Cecil | 404 | (24) | |
| Charles | 1,202 | (78) | 2* |
| Dorchester | 155 | (4) | |
| Frederick | 2,114 | (104) | 7* |
| Garrett | 10 | ||
| Harford | 957 | (50) | 3* |
| Howard | 2,125 | (62) | 5* |
| Kent | 187 | (19) | |
| Montgomery | 12,734 | (617) | 39* |
| Prince George’s | 16,434 | (574) | 24* |
| Queen Anne’s | 170 | (12) | |
| St. Mary’s | 553 | (34) | |
| Somerset | 76 | (3) | 1* |
| Talbot | 108 | (4) | |
| Washington | 548 | (16) | |
| Wicomico | 977 | (32) | |
| Worcester | 235 | (15) | 1* |
| Data not available | (24) | 4* |
By Age Range and Gender
| Age/Gender | Cases | Deaths | |
| 0-9 | 1,506 | ||
| 10-19 | 2,689 | (1) | |
| 20-29 | 8,144 | (13) | 1* |
| 30-39 | 10,803 | (34) | 4* |
| 40-49 | 10,415 | (79) | 3* |
| 50-59 | 9,298 | (191) | 10* |
| 60-69 | 6,751 | (420) | 13* |
| 70-79 | 4,304 | (651) | 19* |
| 80+ | 4,063 | (1,214) | 70* |
| Data not available | (22) | 4* | |
| Female | 30,215 | (1,288) | 66* |
| Male | 27,758 | (1,337) | 58* |
By Race and Ethnicity
| Race/Ethnicity | Cases | Deaths | |
| African-American (NH) | 16,593 | (1,100) | 43* |
| Asian (NH) | 1,093 | (101) | 6* |
| White (NH) | 11,319 | (1,109) | 64* |
| Hispanic | 15,040 | (255) | 7* |
| Other (NH) | 2,882 | (32) | |
| Data not available | 11,046 | (28) | 4* |

