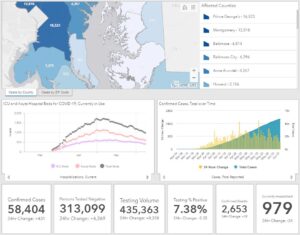
On Monday, June 8, 2020, Maryland reports 58,404 confirmed cases of COVID-19 and 2,653 deaths. An increase of 431 cases, and 28 deaths. Negative tests results now total 313,099, an increase of 6,269 tests.
COVID-19 Statistics in Maryland
Number of confirmed cases : 58,404
Number of persons tested negative : 313,099
Total testing volume : 435,363
Number of confirmed deaths : 2,653
Number of probable deaths : 123
Currently hospitalized : 979
Acute care : 587
Intensive care : 392
Ever hospitalized : 9,629
Released from isolation : 4,240
Cases and Deaths Data Breakdown:
Parenthesis = Confirmed death, laboratory-confirmed positive COVID-19 test result
Asterisk = Probable death, death certificate lists COVID-19 as the cause of death but not yet confirmed by a laboratory test
NH = Non-Hispanic
By County
| County | Cases | Deaths | |
| Allegany | 185 | (16) | |
| Anne Arundel | 4,267 | (176) | 9* |
| Baltimore City | 6,296 | (274) | 8* |
| Baltimore County | 6,814 | (371) | 17* |
| Calvert | 362 | (20) | 1* |
| Caroline | 272 | (1) | |
| Carroll | 954 | (98) | 3* |
| Cecil | 408 | (24) | |
| Charles | 1,211 | (78) | 2* |
| Dorchester | 156 | (4) | |
| Frederick | 2,135 | (104) | 7* |
| Garrett | 10 | ||
| Harford | 961 | (50) | 3* |
| Howard | 2,156 | (63) | 5* |
| Kent | 187 | (19) | |
| Montgomery | 12,818 | (620) | 39* |
| Prince George’s | 16,523 | (578) | 24* |
| Queen Anne’s | 177 | (12) | |
| St. Mary’s | 553 | (34) | |
| Somerset | 77 | (3) | 1* |
| Talbot | 108 | (4) | |
| Washington | 551 | (16) | |
| Wicomico | 984 | (32) | |
| Worcester | 239 | (15) | 1* |
| Data not available | (41) | 3* |
By Age Range and Gender
| Age/Gender | Cases | Deaths | |
| 0-9 | 1,521 | ||
| 10-19 | 2,723 | (1) | |
| 20-29 | 8,216 | (14) | 1* |
| 30-39 | 10,901 | (34) | 4* |
| 40-49 | 10,500 | (80) | 3* |
| 50-59 | 9,365 | (192) | 10* |
| 60-69 | 6,782 | (424) | 13* |
| 70-79 | 4,323 | (651) | 19* |
| 80+ | 4,073 | (1,218) | 70* |
| Data not available | (39) | 3* | |
| Female | 30,435 | (1,300) | 66* |
| Male | 27,969 | (1,353) | 57* |
By Race and Ethnicity
| Race/Ethnicity | Cases | Deaths | |
| African-American (NH) | 16,857 | (1,104) | 43* |
| Asian (NH) | 1,106 | (101) | 6* |
| White (NH) | 11,468 | (1,114) | 64* |
| Hispanic | 15,394 | (258) | 7* |
| Other (NH) | 2,922 | (32) | |
| Data not available | 10,657 | (44) | 3* |

