As of Tuesday, July 14, 2020, Maryland reports 74,260 COVID-19 cases and 3,202 deaths. An increase of 733 cases and 8 deaths overnight.
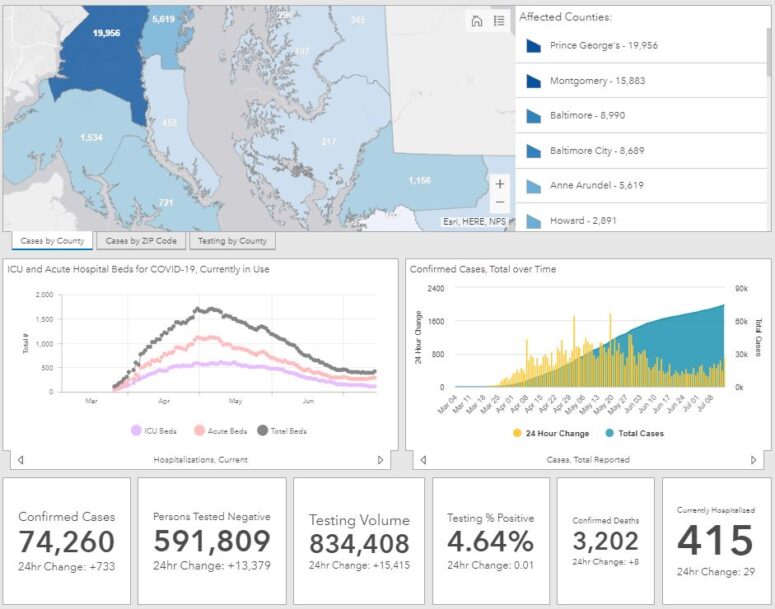
COVID-19 Statistics in Maryland
Number of confirmed cases : 74,260
Number of persons tested negative : 591,809
Total testing volume : 834,408
Number of confirmed deaths : 3,202
Number of probable deaths : 132
Currently hospitalized : 415
Acute care : 297
Intensive care : 118
Ever hospitalized : 11,485
Released from isolation : 5,238
Cases and Deaths Data Breakdown:
Parenthesis = Confirmed death, laboratory-confirmed positive COVID-19 test result
Asterisk = Probable death, death certificate lists COVID-19 as the cause of death but not yet confirmed by a laboratory test
NH = Non-Hispanic
By County
| County | Cases | Deaths | |
| Allegany | 220 | (18) | |
| Anne Arundel | 5,619 | (202) | 8* |
| Baltimore City | 8,689 | (354) | 13* |
| Baltimore County | 8,990 | (476) | 22* |
| Calvert | 458 | (26) | 1* |
| Caroline | 345 | (3) | |
| Carroll | 1,224 | (113) | 3* |
| Cecil | 531 | (28) | 1* |
| Charles | 1,534 | (88) | 2* |
| Dorchester | 217 | (5) | |
| Frederick | 2,619 | (113) | 7* |
| Garrett | 27 | ||
| Harford | 1,311 | (63) | 3* |
| Howard | 2,891 | (90) | 6* |
| Kent | 205 | (22) | 1* |
| Montgomery | 15,883 | (724) | 38* |
| Prince George’s | 19,956 | (692) | 23* |
| Queen Anne’s | 296 | (22) | 1* |
| St. Mary’s | 721 | (51) | |
| Somerset | 103 | (3) | |
| Talbot | 197 | (4) | |
| Washington | 737 | (29) | |
| Wicomico | 1,156 | (42) | |
| Worcester | 331 | (17) | 1* |
| Data not available | (17) | 2* |
By Age Range and Gender
| Age/Gender | Cases | Deaths | |
| 0-9 | 2,327 | ||
| 10-19 | 4,084 | (1) | |
| 20-29 | 11,590 | (18) | 1* |
| 30-39 | 13,905 | (42) | 5* |
| 40-49 | 12,952 | (101) | 3* |
| 50-59 | 11,467 | (251) | 13* |
| 60-69 | 8,130 | (523) | 12* |
| 70-79 | 5,119 | (788) | 20* |
| 80+ | 4,686 | (1,463) | 76* |
| Data not available | (15) | 2* | |
| Female | 38,640 | (1,575) | 69* |
| Male | 35,620 | (1,627) | 63* |
By Race and Ethnicity
| Race/Ethnicity | Cases | Deaths | |
| African-American (NH) | 21,525 | (1,301) | 49* |
| Asian (NH) | 1,446 | (124) | 6* |
| White (NH) | 15,161 | (1,357) | 67* |
| Hispanic | 19,701 | (366) | 8* |
| Other (NH) | 3,551 | (35) | |
| Data not available | 12,876 | (19) | 2* |