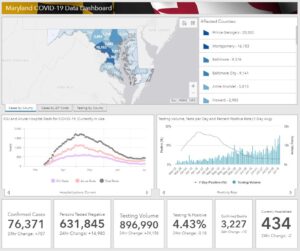
 As of Friday, July 17, 2020, Maryland reports 76,371 COVID-19 cases and 3,227 deaths. An increase of 707 cases and 12 deaths overnight.
COVID-19 Statistics in Maryland
Number of confirmed cases : 76,371
Number of persons tested negative : 631,845
Total testing volume : 896,990
Number of confirmed deaths : 3,227
Number of probable deaths : 132
Currently hospitalized : 434
Acute care : 306
Intensive care : 128
Ever hospitalized : 11,728
Released from isolation : 5,286
Cases and Deaths Data Breakdown:
Parenthesis = Confirmed death, laboratory-confirmed positive COVID-19 test result
Asterisk = Probable death, death certificate lists COVID-19 as the cause of death but not yet confirmed by a laboratory test
NH = Non-Hispanic
By County
| County | Cases | Deaths | |
| Allegany | 227 | (18) | |
| Anne Arundel | 5,813 | (203) | 8* |
| Baltimore City | 9,141 | (360) | 14* |
| Baltimore County | 9,376 | (483) | 22* |
| Calvert | 479 | (26) | 1* |
| Caroline | 351 | (3) | |
| Carroll | 1,248 | (113) | 3* |
| Cecil | 542 | (28) | 1* |
| Charles | 1,583 | (88) | 2* |
| Dorchester | 232 | (5) | |
| Frederick | 2,661 | (113) | 7* |
| Garrett | 30 | ||
| Harford | 1,351 | (63) | 3* |
| Howard | 2,983 | (91) | 6* |
| Kent | 215 | (22) | 1* |
| Montgomery | 16,153 | (728) | 38* |
| Prince George’s | 20,302 | (696) | 23* |
| Queen Anne’s | 305 | (22) | 1* |
| St. Mary’s | 753 | (51) | |
| Somerset | 106 | (3) | |
| Talbot | 230 | (4) | |
| Washington | 751 | (29) | |
| Wicomico | 1,173 | (42) | |
| Worcester | 366 | (17) | 1* |
| Data not available | (19) | 1* |
By Age Range and Gender
| Age/Gender | Cases | Deaths | |
| 0-9 | 2,427 | ||
| 10-19 | 4,267 | (1) | |
| 20-29 | 12,178 | (18) | 1* |
| 30-39 | 14,309 | (43) | 5* |
| 40-49 | 13,248 | (102) | 3* |
| 50-59 | 11,727 | (254) | 13* |
| 60-69 | 8,286 | (523) | 12* |
| 70-79 | 5,192 | (797) | 20* |
| 80+ | 4,737 | (1,473) | 77* |
| Data not available | (16) | 1* | |
| Female | 39,825 | (1,588) | 69* |
| Male | 36,546 | (1,639) | 63* |
By Race and Ethnicity
| Race/Ethnicity | Cases | Deaths | |
| African-American (NH) | 22,225 | (1,310) | 49* |
| Asian (NH) | 1,482 | (124) | 6* |
| White (NH) | 15,846 | (1,367) | 68* |
| Hispanic | 20,063 | (372) | 8* |
| Other (NH) | 3,634 | (36) | |
| Data not available | 13,121 | (18) | 1* |


