 As of Sunday, July 19, 2020, Maryland reports 78,131 COVID-19 cases and 3,227 deaths. An increase of 925 cases and 9 deaths. Friday, July 17, 2020 overnight into Saturday, July 18, 2020, saw an increase of 835 cases and 11 deaths.
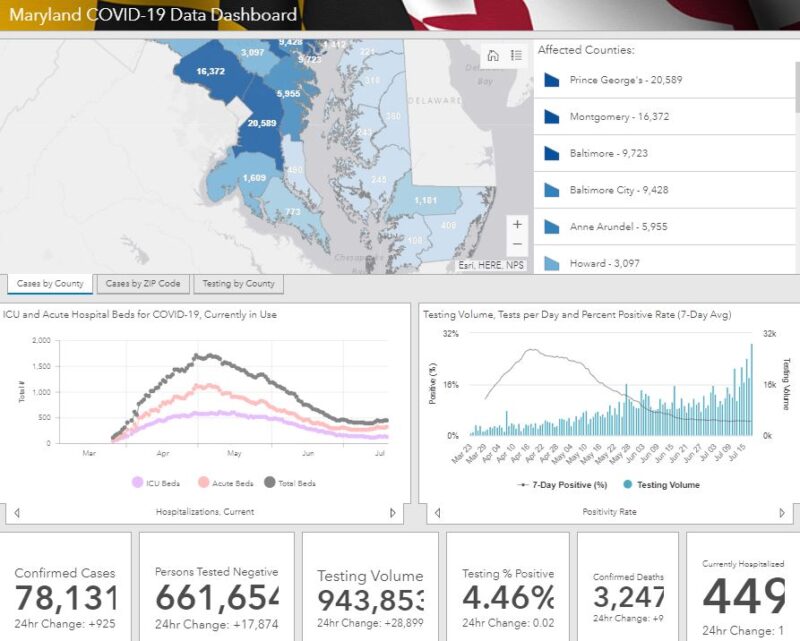
Number of confirmed cases : 78,131
Number of persons tested negative : 661,654
Total testing volume : 943,853
Number of confirmed deaths : 3,247
Number of probable deaths : 130
Currently hospitalized : 449
Acute care : 318
Intensive care : 131
Ever hospitalized : 11,841
Released from isolation : 5,344
Cases and Deaths Data Breakdown:
Parenthesis = Confirmed death, laboratory-confirmed positive COVID-19 test result
Asterisk = Probable death, death certificate lists COVID-19 as the cause of death but not yet confirmed by a laboratory test
NH = Non-Hispanic
By County
| County | Cases | Deaths | |
| Allegany | 237 | (18) | |
| Anne Arundel | 5,955 | (205) | 8* |
| Baltimore City | 9,428 | (368) | 14* |
| Baltimore County | 9,723 | (490) | 20* |
| Calvert | 490 | (26) | 1* |
| Caroline | 360 | (3) | |
| Carroll | 1,269 | (113) | 3* |
| Cecil | 553 | (28) | 1* |
| Charles | 1,609 | (88) | 2* |
| Dorchester | 245 | (5) | |
| Frederick | 2,722 | (113) | 7* |
| Garrett | 34 | ||
| Harford | 1,412 | (63) | 3* |
| Howard | 3,097 | (92) | 6* |
| Kent | 221 | (22) | 1* |
| Montgomery | 16,372 | (730) | 38* |
| Prince George’s | 20,589 | (700) | 23* |
| Queen Anne’s | 318 | (22) | 1* |
| St. Mary’s | 773 | (51) | |
| Somerset | 108 | (3) | |
| Talbot | 243 | (4) | |
| Washington | 784 | (29) | |
| Wicomico | 1,181 | (42) | |
| Worcester | 408 | (17) | 1* |
| Data not available | (15) | 1* |
By Age Range and Gender
| Age/Gender | Cases | Deaths | |
| 0-9 | 2,496 | ||
| 10-19 | 4,430 | (1) | |
| 20-29 | 12,646 | (18) | 1* |
| 30-39 | 14,662 | (45) | 5* |
| 40-49 | 13,500 | (102) | 3* |
| 50-59 | 11,937 | (255) | 13* |
| 60-69 | 8,416 | (527) | 11* |
| 70-79 | 5,255 | (803) | 20* |
| 80+ | 4,789 | (1,484) | 76* |
| Data not available | (12) | 1* | |
| Female | 40,764 | (1,598) | 68* |
| Male | 37,367 | (1,649) | 62* |
By Race and Ethnicity
| Race/Ethnicity | Cases | Deaths | |
| African-American (NH) | 22,887 | (1,322) | 48* |
| Asian (NH) | 1,510 | (124) | 6* |
| White (NH) | 16,383 | (1,374) | 67* |
| Hispanic | 20,321 | (374) | 8* |
| Other (NH) | 3,707 | (37) | |
| Data not available | 13,323 | (16) | 1* |

