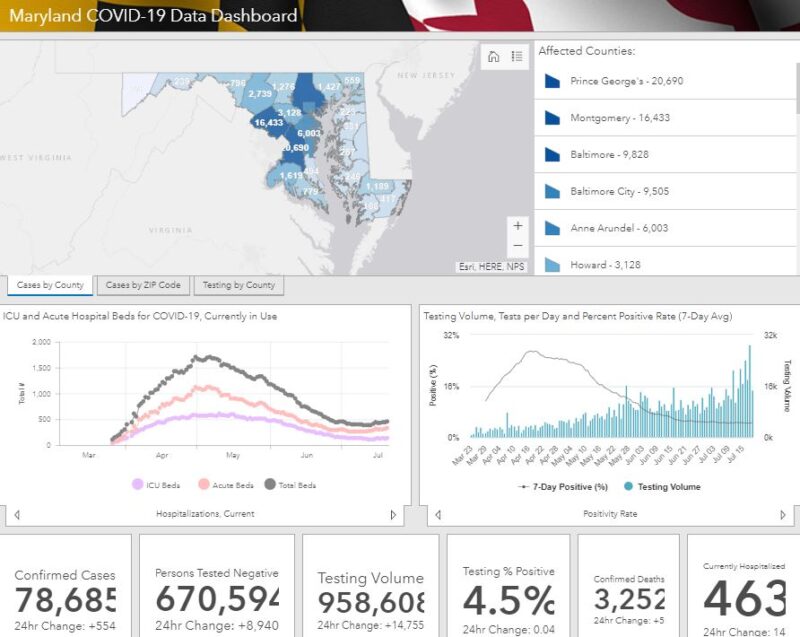
As of Monday, July 20, 2020, Maryland reports 78,685 COVID-19 cases and 3,252 deaths. An increase of 554 cases and 5 deaths.
Number of confirmed cases : 78,685
Number of persons tested negative : 670,594
Total testing volume : 958,608
Number of confirmed deaths : 3,252
Number of probable deaths : 130
Currently hospitalized : 463
Acute care : 327
Intensive care : 136
Ever hospitalized : 11,897
Released from isolation : 5,344
Cases and Deaths Data Breakdown:
Parenthesis = Confirmed death, laboratory-confirmed positive COVID-19 test result
Asterisk = Probable death, death certificate lists COVID-19 as the cause of death but not yet confirmed by a laboratory test
NH = Non-Hispanic
By County
| County | Cases | Deaths | |
| Allegany | 239 | (18) | |
| Anne Arundel | 6,003 | (205) | 8* |
| Baltimore City | 9,505 | (370) | 14* |
| Baltimore County | 9,828 | (492) | 20* |
| Calvert | 494 | (26) | 1* |
| Caroline | 365 | (3) | |
| Carroll | 1,276 | (113) | 3* |
| Cecil | 559 | (28) | 1* |
| Charles | 1,619 | (88) | 2* |
| Dorchester | 246 | (5) | |
| Frederick | 2,739 | (113) | 7* |
| Garrett | 34 | ||
| Harford | 1,427 | (63) | 3* |
| Howard | 3,128 | (92) | 6* |
| Kent | 223 | (22) | 1* |
| Montgomery | 16,433 | (734) | 38* |
| Prince George’s | 20,690 | (700) | 23* |
| Queen Anne’s | 331 | (22) | 1* |
| St. Mary’s | 779 | (52) | |
| Somerset | 108 | (3) | |
| Talbot | 257 | (4) | |
| Washington | 796 | (29) | |
| Wicomico | 1,189 | (42) | |
| Worcester | 417 | (17) | 1* |
| Data not available | (11) | 1* |
By Age Range and Gender
| Age/Gender | Cases | Deaths | |
| 0-9 | 2,519 | ||
| 10-19 | 4,486 | (1) | |
| 20-29 | 12,766 | (18) | 1* |
| 30-39 | 14,768 | (45) | 5* |
| 40-49 | 13,593 | (102) | 3* |
| 50-59 | 12,023 | (257) | 13* |
| 60-69 | 8,452 | (530) | 11* |
| 70-79 | 5,277 | (805) | 20* |
| 80+ | 4,801 | (1,486) | 76* |
| Data not available | (8) | 1* | |
| Female | 41,072 | (1,601) | 68* |
| Male | 37,613 | (1,651) | 62* |
By Race and Ethnicity
| Race/Ethnicity | Cases | Deaths | |
| African-American (NH) | 23,092 | (1,327) | 48* |
| Asian (NH) | 1,520 | (124) | 6* |
| White (NH) | 16,548 | (1,375) | 67* |
| Hispanic | 20,390 | (377) | 8* |
| Other (NH) | 3,732 | (37) | |
| Data not available | 13,403 | (12) | 1* |

