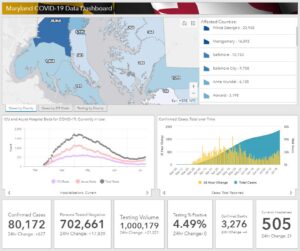
 As of Wednesday, July 23, 2020, Maryland reports 80,172 COVID-19 cases and 3,276 deaths. An increase of 627 cases and 20 deaths.
COVID-19 Statistics in Maryland
Number of confirmed cases : 80,172
Number of persons tested negative : 702,661
Total testing volume : 1,000,179
Number of confirmed deaths : 3,276
Number of probable deaths : 129
Currently hospitalized : 505
Acute care : 368
Intensive care : 137
Ever hospitalized : 11,997
Released from isolation : 5,434
Cases and Deaths Data Breakdown:
Parenthesis = Confirmed death, laboratory-confirmed positive COVID-19 test result
Asterisk = Probable death, death certificate lists COVID-19 as the cause of death but not yet confirmed by a laboratory test
NH = Non-Hispanic
By County
| County | Cases | Deaths | |
| Allegany | 240 | (18) | |
| Anne Arundel | 6,105 | (206) | 8* |
| Baltimore City | 9,738 | (376) | 14* |
| Baltimore County | 10,153 | (499) | 20* |
| Calvert | 503 | (26) | 1* |
| Caroline | 368 | (3) | |
| Carroll | 1,311 | (113) | 3* |
| Cecil | 570 | (29) | 1* |
| Charles | 1,659 | (88) | 2* |
| Dorchester | 288 | (5) | |
| Frederick | 2,797 | (113) | 7* |
| Garrett | 37 | ||
| Harford | 1,472 | (63) | 3* |
| Howard | 3,198 | (93) | 6* |
| Kent | 221 | (22) | 1* |
| Montgomery | 16,593 | (738) | 38* |
| Prince George’s | 20,958 | (702) | 23* |
| Queen Anne’s | 340 | (22) | 1* |
| St. Mary’s | 789 | (53) | |
| Somerset | 110 | (3) | |
| Talbot | 268 | (4) | |
| Washington | 818 | (29) | |
| Wicomico | 1,201 | (42) | |
| Worcester | 435 | (17) | 1* |
| Data not available | (12) |
By Age Range and Gender
| Age/Gender | Cases | Deaths | |
| 0-9 | 2,572 | ||
| 10-19 | 4,613 | (1) | |
| 20-29 | 13,113 | (18) | 1* |
| 30-39 | 15,065 | (44) | 5* |
| 40-49 | 13,796 | (103) | 3* |
| 50-59 | 12,210 | (258) | 13* |
| 60-69 | 8,556 | (531) | 11* |
| 70-79 | 5,363 | (815) | 20* |
| 80+ | 4,884 | (1,496) | 76* |
| Data not available | (10) | ||
| Female | 41,899 | (1,612) | 68* |
| Male | 38,273 | (1,664) | 61* |
By Race and Ethnicity
| Race/Ethnicity | Cases | Deaths | |
| African-American (NH) | 23,503 | (1,336) | 48* |
| Asian (NH) | 1,532 | (125) | 6* |
| White (NH) | 16,887 | (1,387) | 67* |
| Hispanic | 20,505 | (380) | 8* |
| Other (NH) | 3,773 | (36) | |
| Data not available | 13,972 | (12) |

