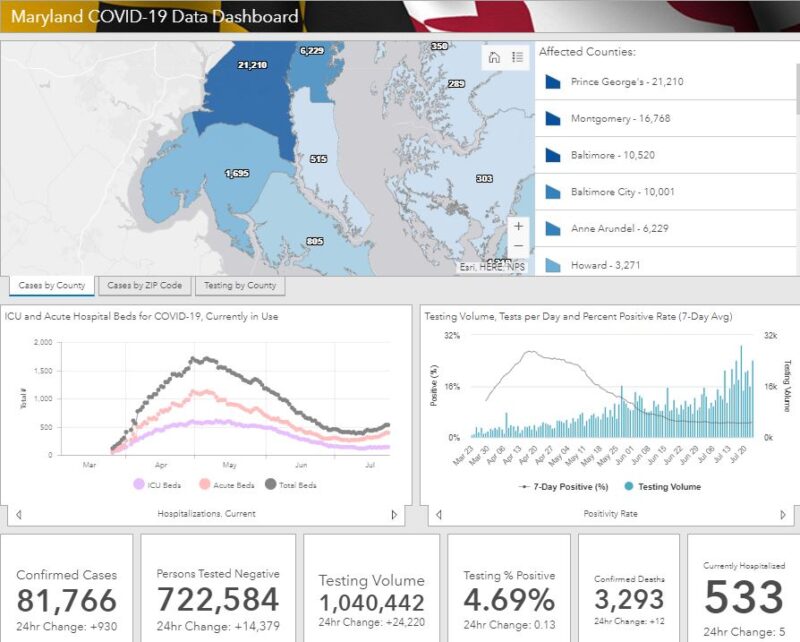
As of Friday, July 24, 2020, Maryland reports 81,766 COVID-19 cases and 3,293 deaths. An increase of 930 cases and 12 deaths.
Number of confirmed cases : 81,766
Number of persons tested negative : 722,584
Total testing volume : 1,040,442
Number of confirmed deaths : 3,293
Number of probable deaths : 129
Currently hospitalized : 533
Acute care : 390
Intensive care : 143
Ever hospitalized : 12,119
Released from isolation : 5,434
Cases and Deaths Data Breakdown:
Parenthesis = Confirmed death, laboratory-confirmed positive COVID-19 test result
Asterisk = Probable death, death certificate lists COVID-19 as the cause of death but not yet confirmed by a laboratory test
NH = Non-Hispanic
By County
| County | Cases | Deaths | |
| Allegany | 244 | (18) | |
| Anne Arundel | 6,229 | (206) | 8* |
| Baltimore City | 10,001 | (381) | 14* |
| Baltimore County | 10,520 | (501) | 20* |
| Calvert | 515 | (26) | 1* |
| Caroline | 374 | (3) | |
| Carroll | 1,337 | (113) | 2* |
| Cecil | 583 | (29) | 1* |
| Charles | 1,695 | (88) | 2* |
| Dorchester | 303 | (5) | |
| Frederick | 2,833 | (113) | 7* |
| Garrett | 41 | ||
| Harford | 1,540 | (64) | 3* |
| Howard | 3,271 | (94) | 6* |
| Kent | 224 | (22) | 1* |
| Montgomery | 16,768 | (744) | 38* |
| Prince George’s | 21,210 | (703) | 23* |
| Queen Anne’s | 350 | (22) | 1* |
| St. Mary’s | 805 | (52) | |
| Somerset | 114 | (3) | |
| Talbot | 289 | (4) | |
| Washington | 833 | (29) | |
| Wicomico | 1,219 | (42) | |
| Worcester | 468 | (17) | 1* |
| Data not available | (14) | 1* |
By Age Range and Gender
| Age/Gender | Cases | Deaths | |
| 0-9 | 2,641 | ||
| 10-19 | 4,750 | (1) | |
| 20-29 | 13,574 | (18) | 1* |
| 30-39 | 15,387 | (44) | 5* |
| 40-49 | 14,013 | (106) | 3* |
| 50-59 | 12,395 | (259) | 13* |
| 60-69 | 8,678 | (536) | 11* |
| 70-79 | 5,419 | (817) | 20* |
| 80+ | 4,909 | (1,500) | 75* |
| Data not available | (12) | 1* | |
| Female | 42,744 | (1,622) | 67* |
| Male | 39,022 | (1,671) | 62* |
By Race and Ethnicity
| Race/Ethnicity | Cases | Deaths | |
| African-American (NH) | 24,310 | (1,342) | 48* |
| Asian (NH) | 1,566 | (125) | 6* |
| White (NH) | 17,486 | (1,392) | 66* |
| Hispanic | 20,795 | (384) | 8* |
| Other (NH) | 3,823 | (36) | |
| Data not available | 13,786 | (14) | 1* |

