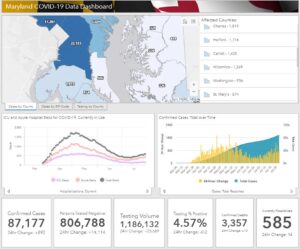
 As of Thursday, July 30, 2020, Maryland reports 87,177 COVID-19 cases and 3,357 deaths. An increase of 892 cases and 10 deaths, in 24 hours.
COVID-19 Statistics in Maryland
Number of confirmed cases : 87,177
Number of persons tested negative : 806,788
Total testing volume : 1,186,132
Number of confirmed deaths : 3,357
Number of probable deaths : 131
Currently hospitalized : 585
Acute care : 446
Intensive care : 139
Ever hospitalized : 12,500
Released from isolation : 5,592
Cases and Deaths Data Breakdown:
Parenthesis = Confirmed death, laboratory-confirmed positive COVID-19 test result
Asterisk = Probable death, death certificate lists COVID-19 as the cause of death but not yet confirmed by a laboratory test
NH = Non-Hispanic
By County
| County | Cases | Deaths | |
| Allegany | 264 | (18) | |
| Anne Arundel | 6,684 | (208) | 8* |
| Baltimore City | 11,004 | (392) | 14* |
| Baltimore County | 11,615 | (523) | 22* |
| Calvert | 565 | (26) | 1* |
| Caroline | 418 | (3) | |
| Carroll | 1,435 | (114) | 2* |
| Cecil | 619 | (29) | 1* |
| Charles | 1,819 | (88) | 2* |
| Dorchester | 326 | (5) | |
| Frederick | 2,964 | (114) | 7* |
| Garrett | 45 | ||
| Harford | 1,716 | (64) | 3* |
| Howard | 3,472 | (99) | 6* |
| Kent | 229 | (22) | 1* |
| Montgomery | 17,397 | (750) | 39* |
| Prince George’s | 22,183 | (711) | 23* |
| Queen Anne’s | 378 | (24) | 1* |
| St. Mary’s | 874 | (53) | |
| Somerset | 117 | (3) | |
| Talbot | 330 | (4) | |
| Washington | 936 | (30) | |
| Wicomico | 1,269 | (44) | |
| Worcester | 518 | (17) | 1* |
| Data not available | (16) |
By Age Range and Gender
| Age/Gender | Cases | Deaths | |
| 0-9 | 2,881 | ||
| 10-19 | 5,299 | (1) | |
| 20-29 | 14,934 | (19) | 1* |
| 30-39 | 16,432 | (45) | 5* |
| 40-49 | 14,763 | (107) | 3* |
| 50-59 | 13,068 | (263) | 15* |
| 60-69 | 9,114 | (550) | 11* |
| 70-79 | 5,640 | (826) | 21* |
| 80+ | 5,046 | (1,533) | 75* |
| Data not available | (13) | ||
| Female | 45,753 | (1,649) | 68* |
| Male | 41,424 | (1,708) | 63* |
By Race and Ethnicity
| Race/Ethnicity | Cases | Deaths | |
| African-American (NH) | 26,601 | (1,371) | 49* |
| Asian (NH) | 1,634 | (127) | 6* |
| White (NH) | 19,023 | (1,420) | 67* |
| Hispanic | 21,422 | (387) | 9* |
| Other (NH) | 4,009 | (35) | |
| Data not available | 14,488 | (17) |

