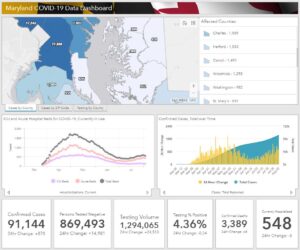
 As of Monday, August 3, 2020, Maryland reports 91,144 COVID-19 cases and 3,389 deaths. An increase of 2,798 cases and 27 deaths, in last 72 hours.
COVID-19 Statistics in Maryland
Number of confirmed cases : 91,144
Number of persons tested negative : 869,493
Total testing volume : 1,294,065
Number of confirmed deaths : 3,389
Number of probable deaths : 134
Currently hospitalized : 548
Acute care : 413
Intensive care : 135
Ever hospitalized : 12,832
Released from isolation : 5,740
Cases and Deaths Data Breakdown:
Parenthesis = Confirmed death, laboratory-confirmed positive COVID-19 test result
Asterisk = Probable death, death certificate lists COVID-19 as the cause of death but not yet confirmed by a laboratory test
NH = Non-Hispanic
By County
| County | Cases | Deaths | |
| Allegany | 273 | (18) | |
| Anne Arundel | 7,007 | (208) | 9* |
| Baltimore City | 11,748 | (399) | 14* |
| Baltimore County | 12,401 | (529) | 22* |
| Calvert | 635 | (27) | 1* |
| Caroline | 438 | (3) | |
| Carroll | 1,491 | (115) | 2* |
| Cecil | 655 | (29) | 1* |
| Charles | 1,909 | (89) | 2* |
| Dorchester | 352 | (5) | |
| Frederick | 3,010 | (114) | 7* |
| Garrett | 43 | ||
| Harford | 1,853 | (65) | 3* |
| Howard | 3,660 | (100) | 6* |
| Kent | 235 | (22) | 1* |
| Montgomery | 17,842 | (754) | 39* |
| Prince George’s | 22,880 | (720) | 23* |
| Queen Anne’s | 399 | (24) | 1* |
| St. Mary’s | 931 | (52) | |
| Somerset | 123 | (3) | |
| Talbot | 368 | (4) | |
| Washington | 982 | (30) | |
| Wicomico | 1,298 | (44) | |
| Worcester | 611 | (18) | 1* |
| Data not available | (17) | 2* |
By Age Range and Gender
| Age/Gender | Cases | Deaths | |
| 0-9 | 3,083 | ||
| 10-19 | 5,720 | (1) | |
| 20-29 | 15,832 | (19) | 1* |
| 30-39 | 17,180 | (45) | 5* |
| 40-49 | 15,336 | (108) | 3* |
| 50-59 | 13,625 | (270) | 15* |
| 60-69 | 9,415 | (556) | 12* |
| 70-79 | 5,835 | (835) | 21* |
| 80+ | 5,118 | (1,541) | 75* |
| Data not available | (14) | 2* | |
| Female | 47,907 | (1,662) | 70* |
| Male | 43,237 | (1,727) | 64* |
By Race and Ethnicity
| Race/Ethnicity | Cases | Deaths | |
| African-American (NH) | 28,163 | (1,385) | 49* |
| Asian (NH) | 1,698 | (127) | 6* |
| White (NH) | 20,140 | (1,430) | 67* |
| Hispanic | 21,896 | (392) | 10* |
| Other (NH) | 4,148 | (37) | |
| Data not available | 15,099 | (18) | 2* |

