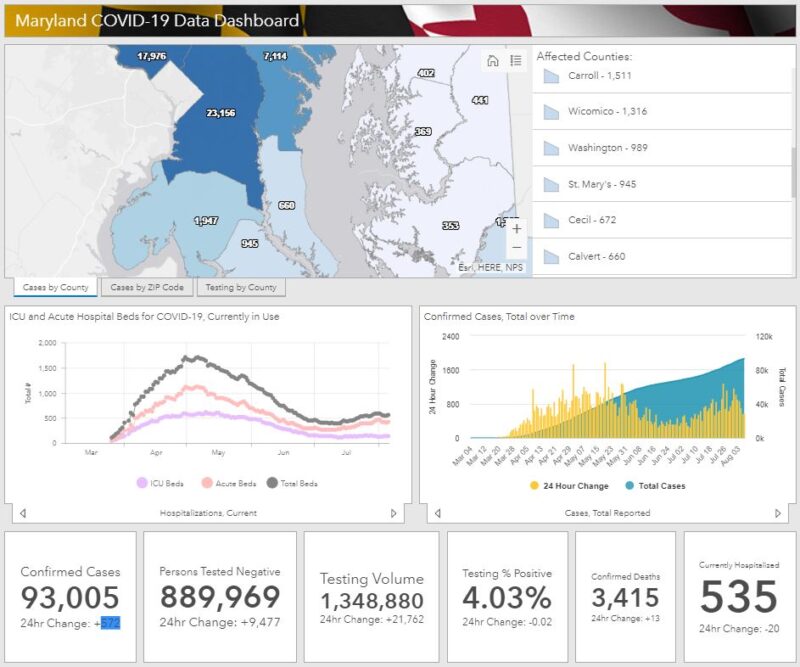
 As of Thursday, August 6, 2020, Maryland reports 93,005 COVID-19 cases and 3,415 deaths. An increase of 572 cases and 13 deaths, in last 24 hours.
COVID-19 Statistics in Maryland
Number of confirmed cases : 93,005
Number of persons tested negative : 899,136
Total testing volume : 1,348,880
Number of confirmed deaths : 3,415
Number of probable deaths : 136
Currently hospitalized : 535
Acute care : 396
Intensive care : 139
Ever hospitalized : 12,978
Released from isolation : 5,790
Cases and Deaths Data Breakdown:
Parenthesis = Confirmed death, laboratory-confirmed positive COVID-19 test result
Asterisk = Probable death, death certificate lists COVID-19 as the cause of death but not yet confirmed by a laboratory test
NH = Non-Hispanic
By County
| County | Cases | Deaths | |
| Allegany | 279 | (18) | |
| Anne Arundel | 7,200 | (211) | 9* |
| Baltimore City | 12,075 | (407) | 15* |
| Baltimore County | 12,777 | (535) | 22* |
| Calvert | 667 | (27) | 1* |
| Caroline | 444 | (3) | |
| Carroll | 1,516 | (115) | 2* |
| Cecil | 681 | (29) | 1* |
| Charles | 1,961 | (89) | 2* |
| Dorchester | 360 | (5) | |
| Frederick | 3,032 | (114) | 7* |
| Garrett | 45 | ||
| Harford | 1,906 | (66) | 3* |
| Howard | 3,729 | (100) | 6* |
| Kent | 236 | (22) | 1* |
| Montgomery | 18,032 | (758) | 39* |
| Prince George’s | 23,225 | (725) | 23* |
| Queen Anne’s | 406 | (24) | 1* |
| St. Mary’s | 951 | (52) | |
| Somerset | 130 | (3) | |
| Talbot | 371 | (4) | |
| Washington | 996 | (31) | |
| Wicomico | 1,322 | (45) | |
| Worcester | 664 | (19) | 1* |
| Data not available | (13) | 3* |
By Age Range and Gender
| Age/Gender | Cases | Deaths | |
| 0-9 | 3,147 | ||
| 10-19 | 5,930 | (1) | |
| 20-29 | 16,244 | (20) | 1* |
| 30-39 | 17,492 | (45) | 5* |
| 40-49 | 15,620 | (109) | 3* |
| 50-59 | 13,898 | (271) | 15* |
| 60-69 | 9,565 | (560) | 12* |
| 70-79 | 5,927 | (842) | 22* |
| 80+ | 5,182 | (1,556) | 75* |
| Data not available | (11) | 3* | |
| Female | 48,931 | (1,679) | 71* |
| Male | 44,074 | (1,736) | 65* |
By Race and Ethnicity
| Race/Ethnicity | Cases | Deaths | |
| African-American (NH) | 28,784 | (1,401) | 50* |
| Asian (NH) | 1,687 | (128) | 6* |
| White (NH) | 20,294 | (1,442) | 67* |
| Hispanic | 23,367 | (395) | 10* |
| Other (NH) | 4,098 | (36) | |
| Data not available | 14,775 | (13) | 3* |